Metrics collection
- Node metrics
- Container metrics
- Application metrics
- Tools
- First metrics pipeline
- Snap
- InfluxDB
- Grafana
- Getting and setting up Snap
- The Snap installer service
- First contact with
snapd - Using
snapctlto interact withsnapd - Checking what we've done
- Actually collecting metrics: introducing tasks
- Our first task manifest
- Creating our first task
- Checking existing tasks
- Viewing our task dollars at work
- Debugging tasks
- Stopping snap
- Snap Tribe Mode
- Running Snap itself on every node
- Starting a daemon through SSH
- Running Snap itself on every node
- Viewing the members of our tribe
- Create an agreement
- Instruct all nodes to join the agreement
- Start a container on every node
- Running InfluxDB
- Creating the InfluxDB service
- Setting up InfluxDB
- Setting a retention policy
- Load Docker collector and InfluxDB publisher
- Start a simple collection task
- If things go wrong...
- Check that metric data shows up in InfluxDB
- Deploy Grafana
- Set up Grafana
- Add InfluxDB as a data source for Grafana
- Create a dashboard in Grafana
- Setting up a graph in Grafana
- Before moving on ...
- Prometheus vs. Snap
- Prometheus components
- It's all about the
/metrics - Collecting metrics with Prometheus on Swarm
- Creating an overlay network for Prometheus
- Running the node exporter
- Running cAdvisor
- Prometheus server configuration
- Passing the configuration to Prometheus
- Building our custom Prometheus image
- Running our custom Prometheus image
- Deploying Prometheus on our cluster
- Checking our Prometheus server
- Injecting a configuration file
- Differences between
configandsecret - Deploying Prometheus with a
config - Specifying a
configin a Compose file - Re-deploying Prometheus with a config
- Accessing the config object from the CLI
- Extracting a config blob
- Displaying metrics directly from Prometheus
- Building the query from scratch
- Displaying a raw metric for all containers
- Selecting metrics for a specific service
- Turn counters into rates
- Aggregate multiple data series
- Collapse dimensions
- Comparing Snap and Prometheus data
- Add Prometheus as a data source in Grafana
- Connecting to Prometheus from Grafana
- Adding the Prometheus data to our dashboard
- Querying Prometheus data from Grafana
- Interpreting results
- More resources on container metrics
We want to gather metrics in a central place
We will gather node metrics and container metrics
We want a nice interface to view them (graphs)
Node metrics
CPU, RAM, disk usage on the whole node
Total number of processes running, and their states
Number of open files, sockets, and their states
I/O activity (disk, network), per operation or volume
Physical/hardware (when applicable): temperature, fan speed ...
... and much more!
Container metrics
Similar to node metrics, but not totally identical
RAM breakdown will be different
- active vs inactive memory
- some memory is shared between containers, and accounted specially
I/O activity is also harder to track
- async writes can cause deferred "charges"
- some page-ins are also shared between containers
For details about container metrics, see:
http://jpetazzo.github.io/2013/10/08/docker-containers-metrics/
Application metrics
Arbitrary metrics related to your application and business
System performance: request latency, error rate ...
Volume information: number of rows in database, message queue size ...
Business data: inventory, items sold, revenue ...
Tools
We will build two different metrics pipelines:
One based on Intel Snap,
Another based on Prometheus.
If you're using Play-With-Docker, skip the exercises relevant to Intel Snap (we rely on a SSH server to deploy, and PWD doesn't have that yet).
First metrics pipeline
We will use three open source Go projects for our first metrics pipeline:
Intel Snap
Collects, processes, and publishes metrics
InfluxDB
Stores metrics
Grafana
Displays metrics visually
Snap
Can collect, process, and publish metric data
Doesn’t store metrics
Works as a daemon (snapd) controlled by a CLI (snapctl)
Offloads collecting, processing, and publishing to plugins
Does nothing out of the box; configuration required!
InfluxDB
Snap doesn't store metrics data
InfluxDB is specifically designed for time-series data
CRud vs. CRUD (you rarely if ever update/delete data)
orthogonal read and write patterns
storage format optimization is key (for disk usage and performance)
Snap has a plugin allowing to publish to InfluxDB
Grafana
Snap cannot show graphs
InfluxDB cannot show graphs
Grafana will take care of that
Grafana can read data from InfluxDB and display it as graphs
Getting and setting up Snap
We will install Snap directly on the nodes
Release tarballs are available from GitHub
We will use a global service
(started on all nodes, including nodes added later)This service will download and unpack Snap in /opt and /usr/local
/opt and /usr/local will be bind-mounted from the host
This service will effectively install Snap on the hosts
The Snap installer service
- This will get Snap on all nodes
docker service create --restart-condition=none --mode global \
       --mount type=bind,source=/usr/local/bin,target=/usr/local/bin \
       --mount type=bind,source=/opt,target=/opt centos sh -c '
SNAPVER=v0.16.1-beta
RELEASEURL=https://github.com/intelsdi-x/snap/releases/download/$SNAPVER
curl -sSL $RELEASEURL/snap-$SNAPVER-linux-amd64.tar.gz |
     tar -C /opt -zxf-
curl -sSL $RELEASEURL/snap-plugins-$SNAPVER-linux-amd64.tar.gz |
     tar -C /opt -zxf-
ln -s snap-$SNAPVER /opt/snap
for BIN in snapd snapctl; do ln -s /opt/snap/bin/$BIN /usr/local/bin/$BIN; done
' # If you copy-paste that block, do not forget that final quote ☺
First contact with snapd
The core of Snap is
snapd, the Snap daemonApplication made up of a REST API, control module, and scheduler module
- Start
snapdwith plugin trust disabled and log level set to debug:snapd -t 0 -l 1
More resources:
https://github.com/intelsdi-x/snap/blob/master/docs/SNAPD.md https://github.com/intelsdi-x/snap/blob/master/docs/SNAPD_CONFIGURATION.md
Using snapctl to interact with snapd
- Let's load a collector and a publisher plugins
Open a new terminal
Load the psutil collector plugin:
snapctl plugin load /opt/snap/plugin/snap-plugin-collector-psutilLoad the file publisher plugin:
snapctl plugin load /opt/snap/plugin/snap-plugin-publisher-mock-file
Checking what we've done
- Good to know: Docker CLI uses
ls, Snap CLI useslist
See your loaded plugins:
snapctl plugin listSee the metrics you can collect:
snapctl metric list
Actually collecting metrics: introducing tasks
To start collecting/processing/publishing metric data, you need to create a task
A task indicates:
- what to collect (which metrics)
- when to collect it (e.g. how often)
- how to process it (e.g. use it directly, or compute moving averages)
- where to publish it
Tasks can be defined with manifests written in JSON or YAML
Some plugins, such as the Docker collector, allow for wildcards (*) in the metrics "path"
(see snap/docker-influxdb.json)More resources: https://github.com/intelsdi-x/snap/blob/master/docs/TASKS.md
Our first task manifest
  version: 1
  schedule:
    type: "simple" # collect on a set interval
    interval: "1s" # of every 1s
  max-failures: 10
  workflow:
    collect: # first collect
      metrics: # metrics to collect
        /intel/psutil/load/load1: {}
      config: # there is no configuration
      publish: # after collecting, publish
        -
            plugin_name: "file" # use the file publisher
            config:
                file: "/tmp/snap-psutil-file.log" # write to this file
Creating our first task
- The task manifest shown on the previous slide is stored in
snap/psutil-file.yml.
Create a task using the manifest:
cd ~/container.training/snap
snapctl task create -t psutil-file.yml
The output should look like the following:
    Using task manifest to create task
    Task created
    ID: 240435e8-a250-4782-80d0-6fff541facba
    Name: Task-240435e8-a250-4782-80d0-6fff541facba
    State: Running
Checking existing tasks
This will confirm that our task is running correctly, and remind us of its task ID
snapctl task list
The output should look like the following:
    ID           NAME              STATE     HIT MISS FAIL CREATED
    24043...acba Task-24043...acba Running   4   0    0    2:34PM   8-13-2016
Viewing our task dollars at work
The task is using a very simple publisher,
mock-fileThat publisher just writes text lines in a file (one line per data point)
- Check that the data is flowing indeed:
tail -f /tmp/snap-psutil-file.log
To exit, hit ^C
Debugging tasks
When a task is not directly writing to a local file, use
snapctl task watchsnapctl task watchwill stream the metrics you are collecting to STDOUT
snapctl task watch <ID>
To exit, hit ^C
Stopping snap
Our Snap deployment has a few flaws:
snapd was started manually
it is running on a single node
the configuration is purely local
- We want to change that!
But first, go back to the terminal where
snapdis running, and hit^CAll tasks will be stopped; all plugins will be unloaded; Snap will exit
Snap Tribe Mode
Tribe is Snap's clustering mechanism
When tribe mode is enabled, nodes can join agreements
When a node in an agreement does something (e.g. load a plugin or run a task),
other nodes of that agreement do the same thingWe will use it to load the Docker collector and InfluxDB publisher on all nodes,
and run a task to use themWithout tribe mode, we would have to load plugins and run tasks manually on every node
More resources: https://github.com/intelsdi-x/snap/blob/master/docs/TRIBE.md
Running Snap itself on every node
- Snap runs in the foreground, so you need to use
&or start it in tmux
- Run the following command on every node:
snapd -t 0 -l 1 --tribe --tribe-seed node1:6000
If you're not using Play-With-Docker, there is another way to start Snap!
Starting a daemon through SSH
.warning[Hackety hack ahead!]
We will create a global service
That global service will install a SSH client
With that SSH client, the service will connect back to its local node
(i.e. "break out" of the container, using the SSH key that we provide)Once logged on the node, the service starts snapd with Tribe Mode enabled
Running Snap itself on every node
- I might go to hell for showing you this, but here it goes ...
- Start Snap all over the place:
  docker service create --name snapd --mode global \
         --mount type=bind,source=$HOME/.ssh/id_rsa,target=/sshkey \
         alpine sh -c "
                apk add --no-cache openssh-client &&
                ssh -o StrictHostKeyChecking=no -i /sshkey docker@172.17.0.1 \
                    sudo snapd -t 0 -l 1 --tribe --tribe-seed node1:6000
         " # If you copy-paste that block, don't forget that final quote :-)
Remember: this does not work with Play-With-Docker (which doesn't have SSH).
Viewing the members of our tribe
- If everything went fine, Snap is now running in tribe mode
- View the members of our tribe:
snapctl member list
This should show the 5 nodes with their hostnames.
Create an agreement
- We can now create an agreement for our plugins and tasks
- Create an agreement; make sure to use the same name all along:
snapctl agreement create docker-influxdb
The output should look like the following:
  Name             Number of Members       plugins      tasks
  docker-influxdb  0                       0            0
Instruct all nodes to join the agreement
We don't need another fancy global service!
We can join nodes from any existing node of the cluster
- Add all nodes to the agreement:
  snapctl member list | tail -n +2 |
    xargs -n1 snapctl agreement join docker-influxdb
The last bit of output should look like the following:
  Name             Number of Members       plugins         tasks
  docker-influxdb  5                       0               0
Start a container on every node
The Docker plugin requires at least one container to be started
Normally, at this point, you will have at least one container on each node
But just in case you did things differently, let's create a dummy global service
- Create an alpine container on the whole cluster:
docker service create --name ping --mode global alpine ping 8.8.8.8
Running InfluxDB
We will create a service for InfluxDB
We will use the official image
InfluxDB uses multiple ports:
8086 (HTTP API; we need this)
8083 (admin interface; we need this)
8088 (cluster communication; not needed here)
more ports for other protocols (graphite, collectd...)
We will just publish the first two
Creating the InfluxDB service
- Start an InfluxDB service, publishing ports 8083 and 8086:
  docker service create --name influxdb \
         --publish 8083:8083 \
         --publish 8086:8086 \
         influxdb:0.13
Note: this will allow any node to publish metrics data to localhost:8086,
and it will allows us to access the admin interface by connecting to any node
on port 8083.
.warning[Make sure to use InfluxDB 0.13; a few things changed in 1.0 (like, the name of the default retention policy is now "autogen") and this breaks a few things.]
Setting up InfluxDB
- We need to create the "snap" database
Open port 8083 with your browser
Enter the following query in the query box:
CREATE DATABASE "snap"In the top-right corner, select "Database: snap"
Note: the InfluxDB query language looks like SQL but it's not.
???
Setting a retention policy
When graduating to 1.0, InfluxDB changed the name of the default policy
It used to be "default" and it is now "autogen"
Snap still uses "default" and this results in errors
- Create a "default" retention policy by entering the following query in the box:
CREATE RETENTION POLICY "default" ON "snap" DURATION 1w REPLICATION 1
Load Docker collector and InfluxDB publisher
We will load plugins on the local node
Since our local node is a member of the agreement, all other nodes in the agreement will also load these plugins
Load Docker collector:
snapctl plugin load /opt/snap/plugin/snap-plugin-collector-dockerLoad InfluxDB publisher:
snapctl plugin load /opt/snap/plugin/snap-plugin-publisher-influxdb
Start a simple collection task
Again, we will create a task on the local node
The task will be replicated on other nodes members of the same agreement
- Load a task manifest file collecting a couple of metrics on all containers,
and sending them to InfluxDB:cd ~/container.training/snap snapctl task create -t docker-influxdb.json
Note: the task description sends metrics to the InfluxDB API endpoint located at 127.0.0.1:8086. Since the InfluxDB container is published on port 8086, 127.0.0.1:8086 always routes traffic to the InfluxDB container.
If things go wrong...
Note: if a task runs into a problem (e.g. it's trying to publish to a metrics database, but the database is unreachable), the task will be stopped.
You will have to restart it manually by running:
snapctl task enable <ID>
snapctl task start <ID>
This must be done per node. Alternatively, you can delete+re-create the task (it will delete+re-create on all nodes).
Check that metric data shows up in InfluxDB
- Let's check existing data with a few manual queries in the InfluxDB admin interface
List "measurements":
SHOW MEASUREMENTS(This should show two generic entries corresponding to the two collected metrics.)
View time series data for one of the metrics:
SELECT * FROM "intel/docker/stats/cgroups/cpu_stats/cpu_usage/total_usage"(This should show a list of data points with time, docker_id, source, and value.)
Deploy Grafana
We will use an almost-official image,
grafana/grafanaWe will publish Grafana's web interface on its default port (3000)
- Create the Grafana service:
docker service create --name grafana --publish 3000:3000 grafana/grafana:3.1.1
Set up Grafana
Open port 3000 with your browser
Identify with "admin" as the username and password
Click on the Grafana logo (the orange spiral in the top left corner)
Click on "Data Sources"
Click on "Add data source" (green button on the right)
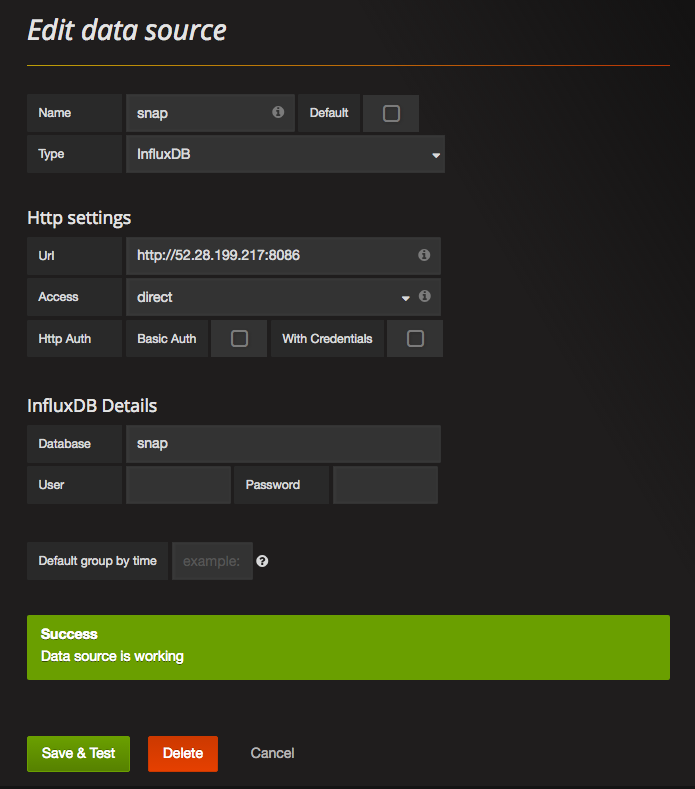
Add InfluxDB as a data source for Grafana
Fill the form exactly as follows:
- Name = "snap"
- Type = "InfluxDB"
In HTTP settings, fill as follows:
- Url = "http://(IP.address.of.any.node):8086"
- Access = "direct"
- Leave HTTP Auth untouched
In InfluxDB details, fill as follows:
- Database = "snap"
- Leave user and password blank
Finally, click on "add", you should see a green message saying "Success - Data source is working". If you see an orange box (sometimes without a message), it means that you got something wrong. Triple check everything again.
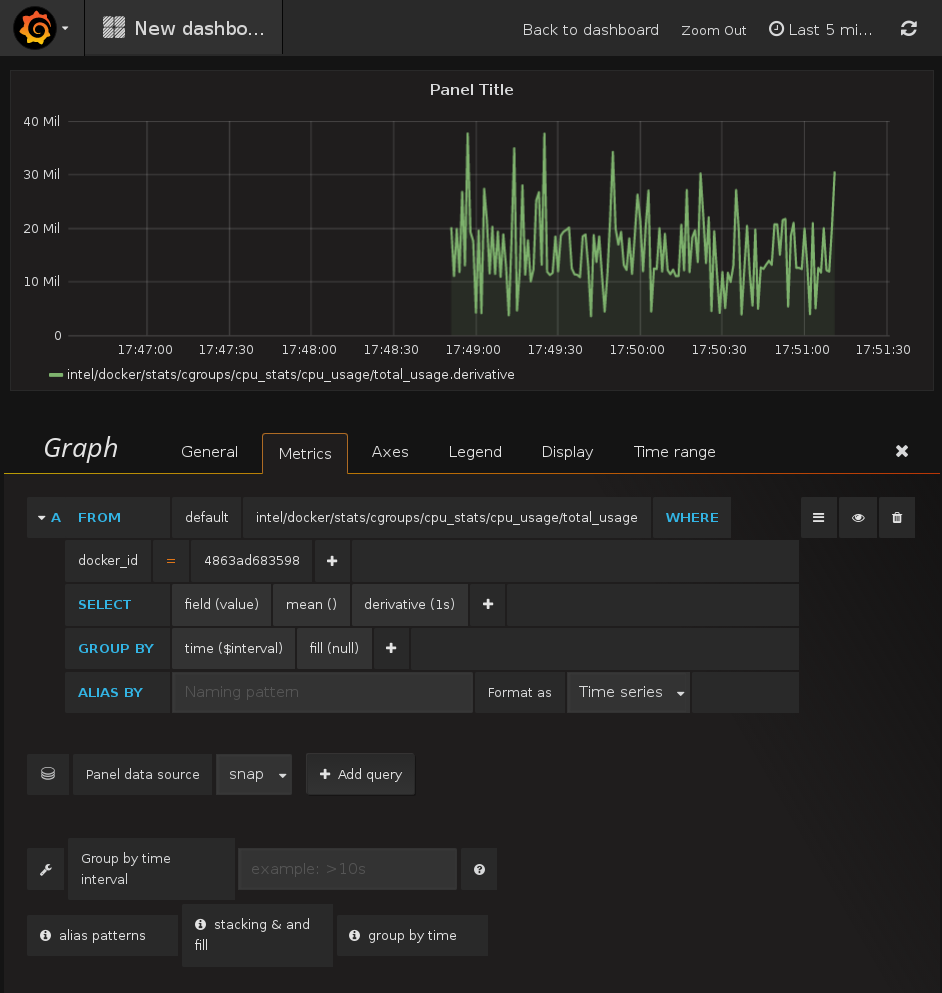
Create a dashboard in Grafana
Click on the Grafana logo again (the orange spiral in the top left corner)
Hover over "Dashboards"
Click "+ New"
Click on the little green rectangle that appeared in the top left
Hover over "Add Panel"
Click on "Graph"
At this point, you should see a sample graph showing up.
Setting up a graph in Grafana
- Panel data source: select snap
- Click on the SELECT metrics query to expand it
- Click on "select measurement" and pick CPU usage
- Click on the "+" right next to "WHERE"
- Select "docker_id"
- Select the ID of a container of your choice (e.g. the one running InfluxDB)
- Click on the "+" on the right of the "SELECT" line
- Add "derivative"
- In the "derivative" option, select "1s"
- In the top right corner, click on the clock, and pick "last 5 minutes"
Congratulations, you are viewing the CPU usage of a single container!
Before moving on ...
Leave that tab open!
We are going to set up another metrics system
... And then compare both graphs side by side
Prometheus vs. Snap
Prometheus is another metrics collection system
Snap pushes metrics; Prometheus pulls them
Prometheus components
The Prometheus server pulls, stores, and displays metrics
Its configuration defines a list of exporter endpoints
(that list can be dynamic, using e.g. Consul, DNS, Etcd...)The exporters expose metrics over HTTP using a simple line-oriented format
(An optimized format using protobuf is also possible)
It's all about the /metrics
This is what the node exporter looks like:
Prometheus itself exposes its own internal metrics, too:
A Prometheus server will scrape URLs like these
(It can also use protobuf to avoid the overhead of parsing line-oriented formats!)
Collecting metrics with Prometheus on Swarm
We will run two global services (i.e. scheduled on all our nodes):
the Prometheus node exporter to get node metrics
Google's cAdvisor to get container metrics
We will run a Prometheus server to scrape these exporters
The Prometheus server will be configured to use DNS service discovery
We will use
tasks.<servicename>for service discoveryAll these services will be placed on a private internal network
Creating an overlay network for Prometheus
- This is the easiest step ☺
- Create an overlay network:
docker network create --driver overlay prom
Running the node exporter
- The node exporter should run directly on the hosts
- However, it can run from a container, if configured properly
(it needs to access the host's filesystems, in particular /proc and /sys)
- Start the node exporter:
  docker service create --name node --mode global --network prom \
   --mount type=bind,source=/proc,target=/host/proc \
   --mount type=bind,source=/sys,target=/host/sys \
   --mount type=bind,source=/,target=/rootfs \
   prom/node-exporter \
    --path.procfs /host/proc \
    --path.sysfs /host/proc \
    --collector.filesystem.ignored-mount-points "^/(sys|proc|dev|host|etc)($|/)"
Running cAdvisor
Likewise, cAdvisor should run directly on the hosts
But it can run in containers, if configured properly
- Start the cAdvisor collector:
  docker service create --name cadvisor --network prom --mode global \
    --mount type=bind,source=/,target=/rootfs \
    --mount type=bind,source=/var/run,target=/var/run \
    --mount type=bind,source=/sys,target=/sys \
    --mount type=bind,source=/var/lib/docker,target=/var/lib/docker \
    google/cadvisor:latest
Prometheus server configuration
This will be our configuration file for Prometheus:
global:
  scrape_interval: 10s
scrape_configs:
  - job_name: 'prometheus'
    static_configs:
      - targets: ['localhost:9090']
  - job_name: 'node'
    dns_sd_configs:
      - names: ['tasks.node']
        type: 'A'
        port: 9100
  - job_name: 'cadvisor'
    dns_sd_configs:
      - names: ['tasks.cadvisor']
        type: 'A'
        port: 8080
Passing the configuration to Prometheus
The easiest solution is to create a custom image bundling this configuration
We will use a very simple Dockerfile:
FROM prom/prometheus:v1.4.1
COPY prometheus.yml /etc/prometheus/prometheus.yml
(The configuration file, and the Dockerfile, are in the
promsubdirectory)We will build this image, and push it to our local registry
Then we will create a service using this image
Note: it is also possible to use a config to inject that configuration file
without having to create this ad-hoc image.
Building our custom Prometheus image
- We will use the local registry started previously on 127.0.0.1:5000
Build the image using the provided Dockerfile:
docker build -t 127.0.0.1:5000/prometheus ~/container.training/promPush the image to our local registry:
docker push 127.0.0.1:5000/prometheus
Running our custom Prometheus image
That's the only service that needs to be published
(If we want to access Prometheus from outside!)
- Start the Prometheus server:
  docker service create --network prom --name prom \
         --publish 9090:9090 127.0.0.1:5000/prometheus
Deploying Prometheus on our cluster
- We will use a stack definition (once again)
Make sure we are in the stacks directory:
cd ~/container.training/stacksBuild, ship, and run the Prometheus stack:
docker-compose -f prometheus.yml build
docker-compose -f prometheus.yml push
docker stack deploy -c prometheus.yml prometheus
Checking our Prometheus server
- First, let's make sure that Prometheus is correctly scraping all metrics
Open port 9090 with your browser
Click on "status", then "targets"
You should see 7 endpoints (3 cadvisor, 3 node, 1 prometheus).
Their state should be "UP".
Injecting a configuration file
(New in Docker Engine 17.06)
We are creating a custom image just to inject a configuration
Instead, we could use the base Prometheus image + a
configA
configis a blob (usually, a configuration file) that:is created and managed through the Docker API (and CLI)
gets persisted into the Raft log (i.e. safely)
can be associated to a service
(this injects the blob as a plain file in the service's containers)
Differences between config and secret
The two are very similar, but ...
configs:can be injected to any filesystem location
can be viewed and extracted using the Docker API or CLI
secrets:can only be injected into
/run/secretsare never stored in clear text on disk
cannot be viewed or extracted with the Docker API or CLI
Deploying Prometheus with a config
The following Compose file (prometheus+config.yml) achieves
the same result, but by using a config instead of baking the
configuration into the image.
version: "3.3"

services:

prometheus:
  image: prom/prometheus:v1.4.1
  ports:
    - "9090:9090"
  configs:
    - source: prometheus
      target: /etc/prometheus/prometheus.yml

...

configs:
  prometheus:
    file: ../prom/prometheus.yml
Specifying a config in a Compose file
In each service, an optional
configssection can list as many configs as you wantEach config can specify:
an optional
target(path to inject the configuration; by default: root of the container)ownership and permissions (by default, the file will be owned by UID 0, i.e.
root)
These configs reference top-level
configselementsThe top-level configs can be declared as:
external, meaning that it is supposed to be created before you deploy the stack
referencing a file, whose content is used to initialize the config
Re-deploying Prometheus with a config
- We will update the existing stack using
prometheus+config.yml
Redeploy the
prometheusstack:docker stack deploy -c prometheus+config.yml prometheusCheck that Prometheus still works as intended
(By connecting to any node of the cluster, on port 9090)
Accessing the config object from the CLI
- Config objects can be viewed from the Docker CLI (or API)
List existing config objects:
docker config lsView details about our config object:
docker config inspect prometheus_prometheus
Note: the content of the config blob is shown with BASE64 encoding.
(It doesn't have to be text; it could be an image or any kind of binary content!)
Extracting a config blob
- Let's retrieve that Prometheus configuration!
Extract the BASE64 payload with
jq:docker config inspect prometheus_prometheus | jq -r .[0].Spec.DataDecode it with
base64 -d:docker config inspect prometheus_prometheus | jq -r .[0].Spec.Data | base64 -d
Displaying metrics directly from Prometheus
- This is easy ... if you are familiar with PromQL
Click on "Graph", and in "expression", paste the following:
  sum by (container_label_com_docker_swarm_node_id) (
    irate(
      container_cpu_usage_seconds_total{
        container_label_com_docker_swarm_service_name="dockercoins_worker"
        }[1m]
    )
  )
Click on the blue "Execute" button and on the "Graph" tab just below
Building the query from scratch
We are going to build the same query from scratch
This doesn't intend to be a detailed PromQL course
This is merely so that you (I) can pretend to know how the previous query works
so that your coworkers (you) can be suitably impressed (or not)(Or, so that we can build other queries if necessary, or adapt if cAdvisor, Prometheus, or anything else changes and requires editing the query!)
Displaying a raw metric for all containers
Click on the "Graph" tab on top
This takes us to a blank dashboard
Click on the "Insert metric at cursor" drop down, and select
container_cpu_usage_seconds_totalThis puts the metric name in the query box
Click on "Execute"
This fills a table of measurements below
Click on "Graph" (next to "Console")
This replaces the table of measurements with a series of graphs (after a few seconds)
Selecting metrics for a specific service
Hover over the lines in the graph
(Look for the ones that have labels like
container_label_com_docker_...)Edit the query, adding a condition between curly braces:
container_cpu_usage_seconds_total{container_label_com_docker_swarm_service_name="dockercoins_worker"}Click on "Execute"
Now we should see one line per CPU per container
If you want to select by container ID, you can use a regex match:
id=~"/docker/c4bf.*"You can also specify multiple conditions by separating them with commas
Turn counters into rates
What we see is the total amount of CPU used (in seconds)
We want to see a rate (CPU time used / real time)
To get a moving average over 1 minute periods, enclose the current expression within:
rate ( ... { ... } [1m] )This should turn our steadily-increasing CPU counter into a wavy graph
To get an instantaneous rate, use
irateinstead ofrate(The time window is then used to limit how far behind to look for data if data points are missing in case of scrape failure; see here for more details!)
This should show spikes that were previously invisible because they were smoothed out
Aggregate multiple data series
We have one graph per CPU per container; we want to sum them
Enclose the whole expression within:
sum ( ... )We now see a single graph
Collapse dimensions
If we have multiple containers we can also collapse just the CPU dimension:
sum without (cpu) ( ... )This shows the same graph, but preserves the other labels
Congratulations, you wrote your first PromQL expression from scratch!
(I'd like to thank Johannes Ziemke and Julius Volz for their help with Prometheus!)
Comparing Snap and Prometheus data
If you haven't set up Snap, InfluxDB, and Grafana, skip this section
If you have closed the Grafana tab, you might have to re-set up a new dashboard
(Unless you saved it before navigating it away)
To re-do the setup, just follow again the instructions from the previous chapter
Add Prometheus as a data source in Grafana
In a new tab, connect to Grafana (port 3000)
Click on the Grafana logo (the orange spiral in the top-left corner)
Click on "Data Sources"
Click on the green "Add data source" button
We see the same input form that we filled earlier to connect to InfluxDB.
Connecting to Prometheus from Grafana
Enter "prom" in the name field
Select "Prometheus" as the source type
Enter http://(IP.address.of.any.node):9090 in the Url field
Select "direct" as the access method
Click on "Save and test"
Again, we should see a green box telling us "Data source is working."
Otherwise, double-check every field and try again!
Adding the Prometheus data to our dashboard
Go back to the the tab where we had our first Grafana dashboard
Click on the blue "Add row" button in the lower right corner
Click on the green tab on the left; select "Add panel" and "Graph"
This takes us to the graph editor that we used earlier.
Querying Prometheus data from Grafana
The editor is a bit less friendly than the one we used for InfluxDB.
Select "prom" as Panel data source
Paste the query in the query field:
  sum without (cpu, id) ( irate (
    container_cpu_usage_seconds_total{
      container_label_com_docker_swarm_service_name="influxdb"}[1m] ) )
Click outside of the query field to confirm
Close the row editor by clicking the "X" in the top right area
Interpreting results
The two graphs should be similar
Protip: align the time references!
Click on the clock in the top right corner
Select "last 30 minutes"
Click on "Zoom out"
Now press the right arrow key (hold it down and watch the CPU usage increase!)
Adjusting units is left as an exercise for the reader.
More resources on container metrics
Prometheus, a Whirlwind Tour, an original overview of Prometheus
Docker Swarm & Container Overview, a custom dashboard for Grafana
Gathering Container Metrics, a blog post about cgroups
The Prometheus Time Series Database, a talk explaining why custom data storage is necessary for metrics
.blackbelt[DC17US: Monitoring, the Prometheus Way (video)]
.blackbelt[DC17EU: Prometheus 2.0 Storage Engine (video)]